
前两篇讲到了如何安装SkyWalking和利用Prometheus集成钉钉告警。在升级到最新的SkyWalking9.2后,Dashboard面板多了个数据库监控(包括MySQL,Postgres)。由于项目用到的数据库是MySQL,因此这里只介绍MySQL Server数据库监控的配置(Postgres配置也大差不差)。
通过官方文档可以知道,整个数据库监控流程如下图:
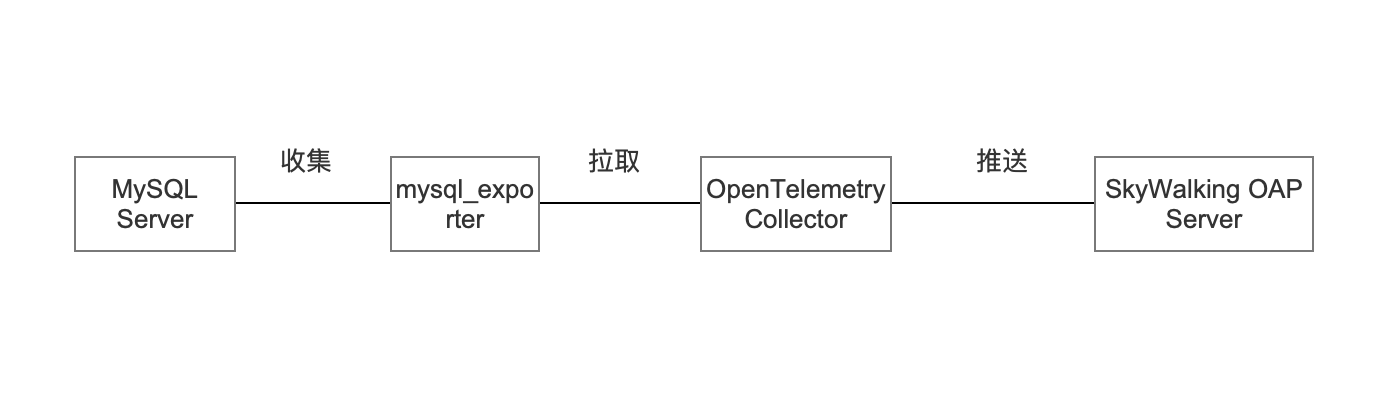
- mysqld_exporter 从 MySQL Server 收集 metrics 数据;
- OpenTelemetry Collector 通过 Prometheus Receiver 从 mysqld_exporter 抓取 metrics 数据;
- OpenTelemetry Collector 通过 OpenCensus gRPC Exporter 或 OpenTelemetry gRPC exporter 将 metrics 数据 发送给 SkyWalking OAP Server;
1.安装过程
1.1 事前准备
这里我们有已经在运行的MySQL数据库,以及链路监控系统SkyWalking。这里假设数据库服务器IP为192.168.2.136,首先需要确保有PROCESS, REPLICATION CLIENT,SELECT这三个权限的MySQL账户。
1.2 安装mysql_exporter(此agent版本为0.14.0)
wget https://github.com/prometheus/mysqld_exporter/releases/download/v0.14.0/mysqld_exporter-0.14.0.linux-amd64.tar.gz
tar -zxvf mysqld_exporter-0.14.0.linux-amd64.tar.gz && cd mysqld_exporter-0.14.0.linux-amd64
在mysqld_exporter路径下创建my.cnf,添加刚才创建的exporter用户和密码
vim my.cnf
[client]
port=3306
user=user
password=password
配置完成后后台启动mysql_exporter程序
nohup ./mysqld_exporter --config.my-cnf=./my.cnf &
1.3 Docker安装opentelemetry-collector
为了方便这里采用docker的方式安装。
- 下载镜像
- 配置otel-collector-config.yaml
# Licensed to the Apache Software Foundation (ASF) under one or more
# contributor license agreements.  See the NOTICE file distributed with
# this work for additional information regarding copyright ownership.
# The ASF licenses this file to You under the Apache License, Version 2.0
# (the "License"); you may not use this file except in compliance with
# the License.  You may obtain a copy of the License at
#
#     http://www.apache.org/licenses/LICENSE-2.0
#
# Unless required by applicable law or agreed to in writing, software
# distributed under the License is distributed on an "AS IS" BASIS,
# WITHOUT WARRANTIES OR CONDITIONS OF ANY KIND, either express or implied.
# See the License for the specific language governing permissions and
# limitations under the License.

receivers:
  prometheus:
    config:
     scrape_configs:
       - job_name: 'sg-prod-mysql-main'
         scrape_interval: 5s
         static_configs:
           - targets: ['IP:9104']
             labels:
               host_name: DB
processors:
  batch:

exporters:
  otlp:
    endpoint: SkyWalking OAP:11800
    tls:
      insecure: true
service:
  pipelines:
    metrics:
      receivers:
      - prometheus
      processors:
      - batch
      exporters:
      - otlp
- 启动opentelemetry-collector
sudo docker run -d --restart=unless-stopped --name opentelemetry -v /export/servers/opentelemetry-collector/config.yaml:/etc/otelcol/config.yaml -v /etc/localtime:/etc/localtime otel/opentelemetry-collector:0.60.0
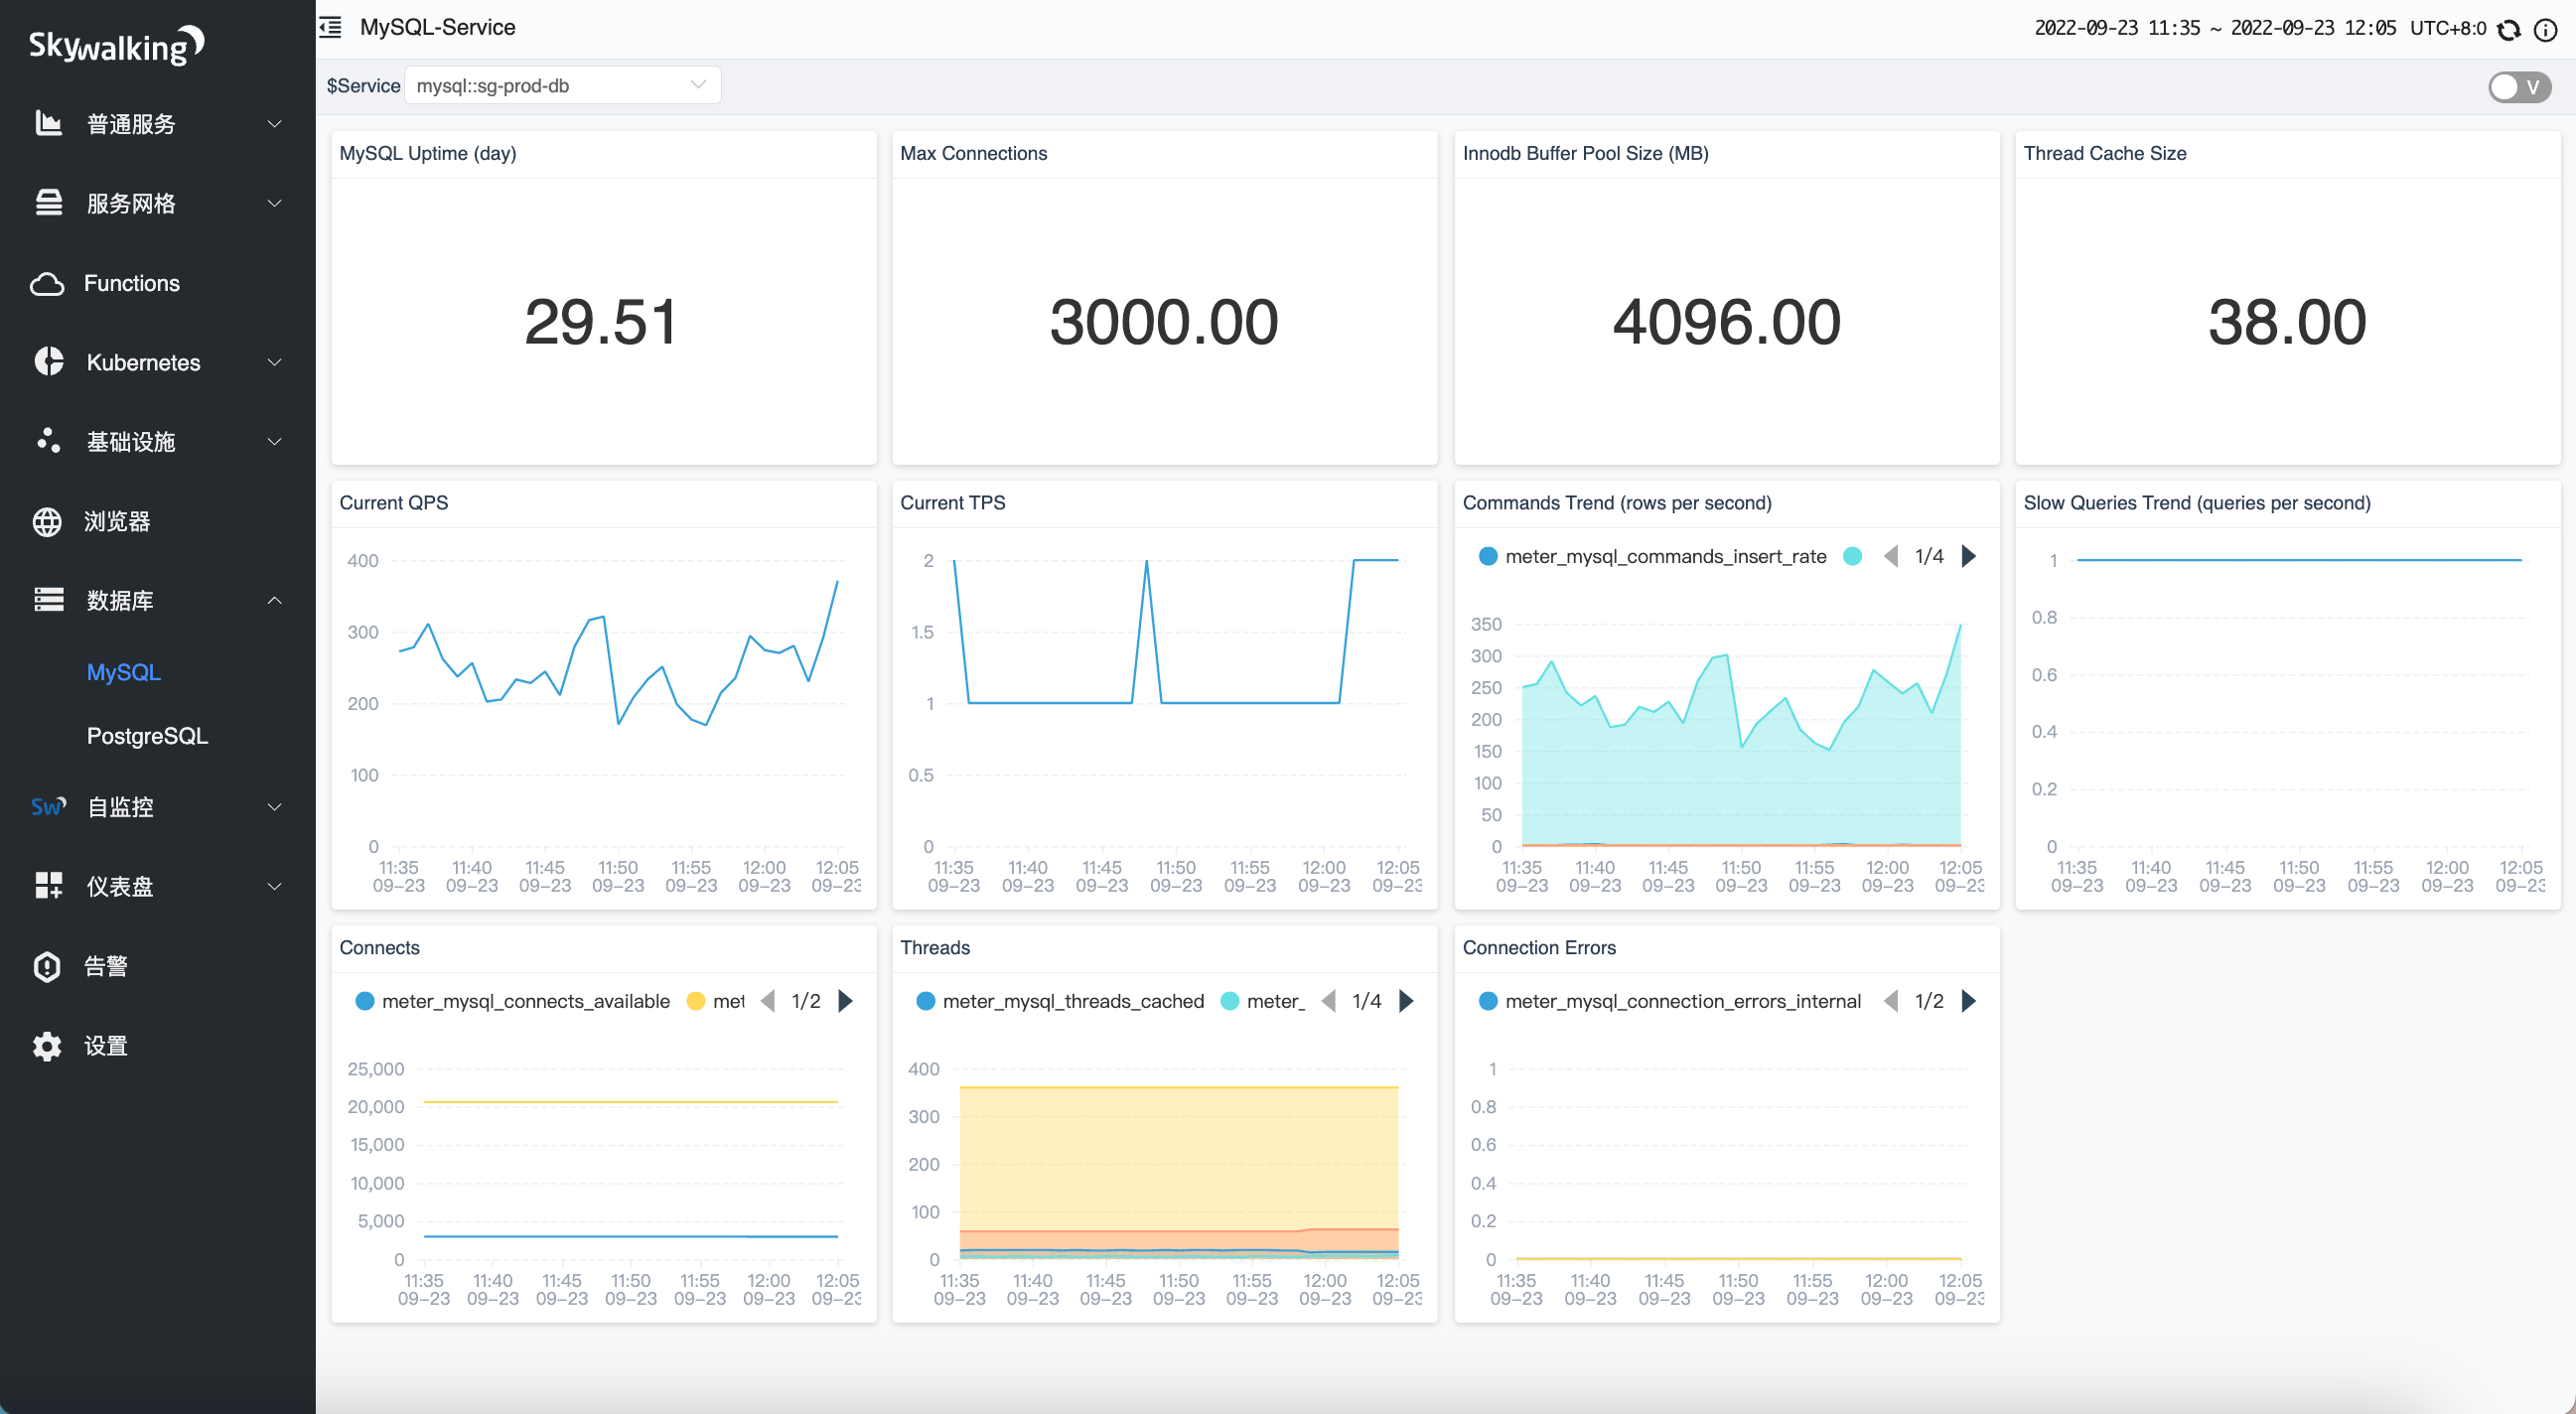
1.4 查看SkyWalking面板数据
确定mysqld-exporter 和 otel-collector 服务能正常采集数据之后,就可以访问 SkyWalking UI,可以查看到 MySQL Sever 端的监控信息了。
遇坑小结:
mysqld-exporter端收集数据正常,但是SkyWalking面板没有数据。遇到这个问题知道问题出在了otel-collector端。排查后发现官方模板的配置为:
receivers:
  prometheus:
    config:
     scrape_configs:
       - job_name: 'mysql-monitoring'
         scrape_interval: 5s
         static_configs:
           - targets: ['mysql-service:9104']
             labels:
               host_name: showcase
而我改了job_name的名称。根据文档介绍:
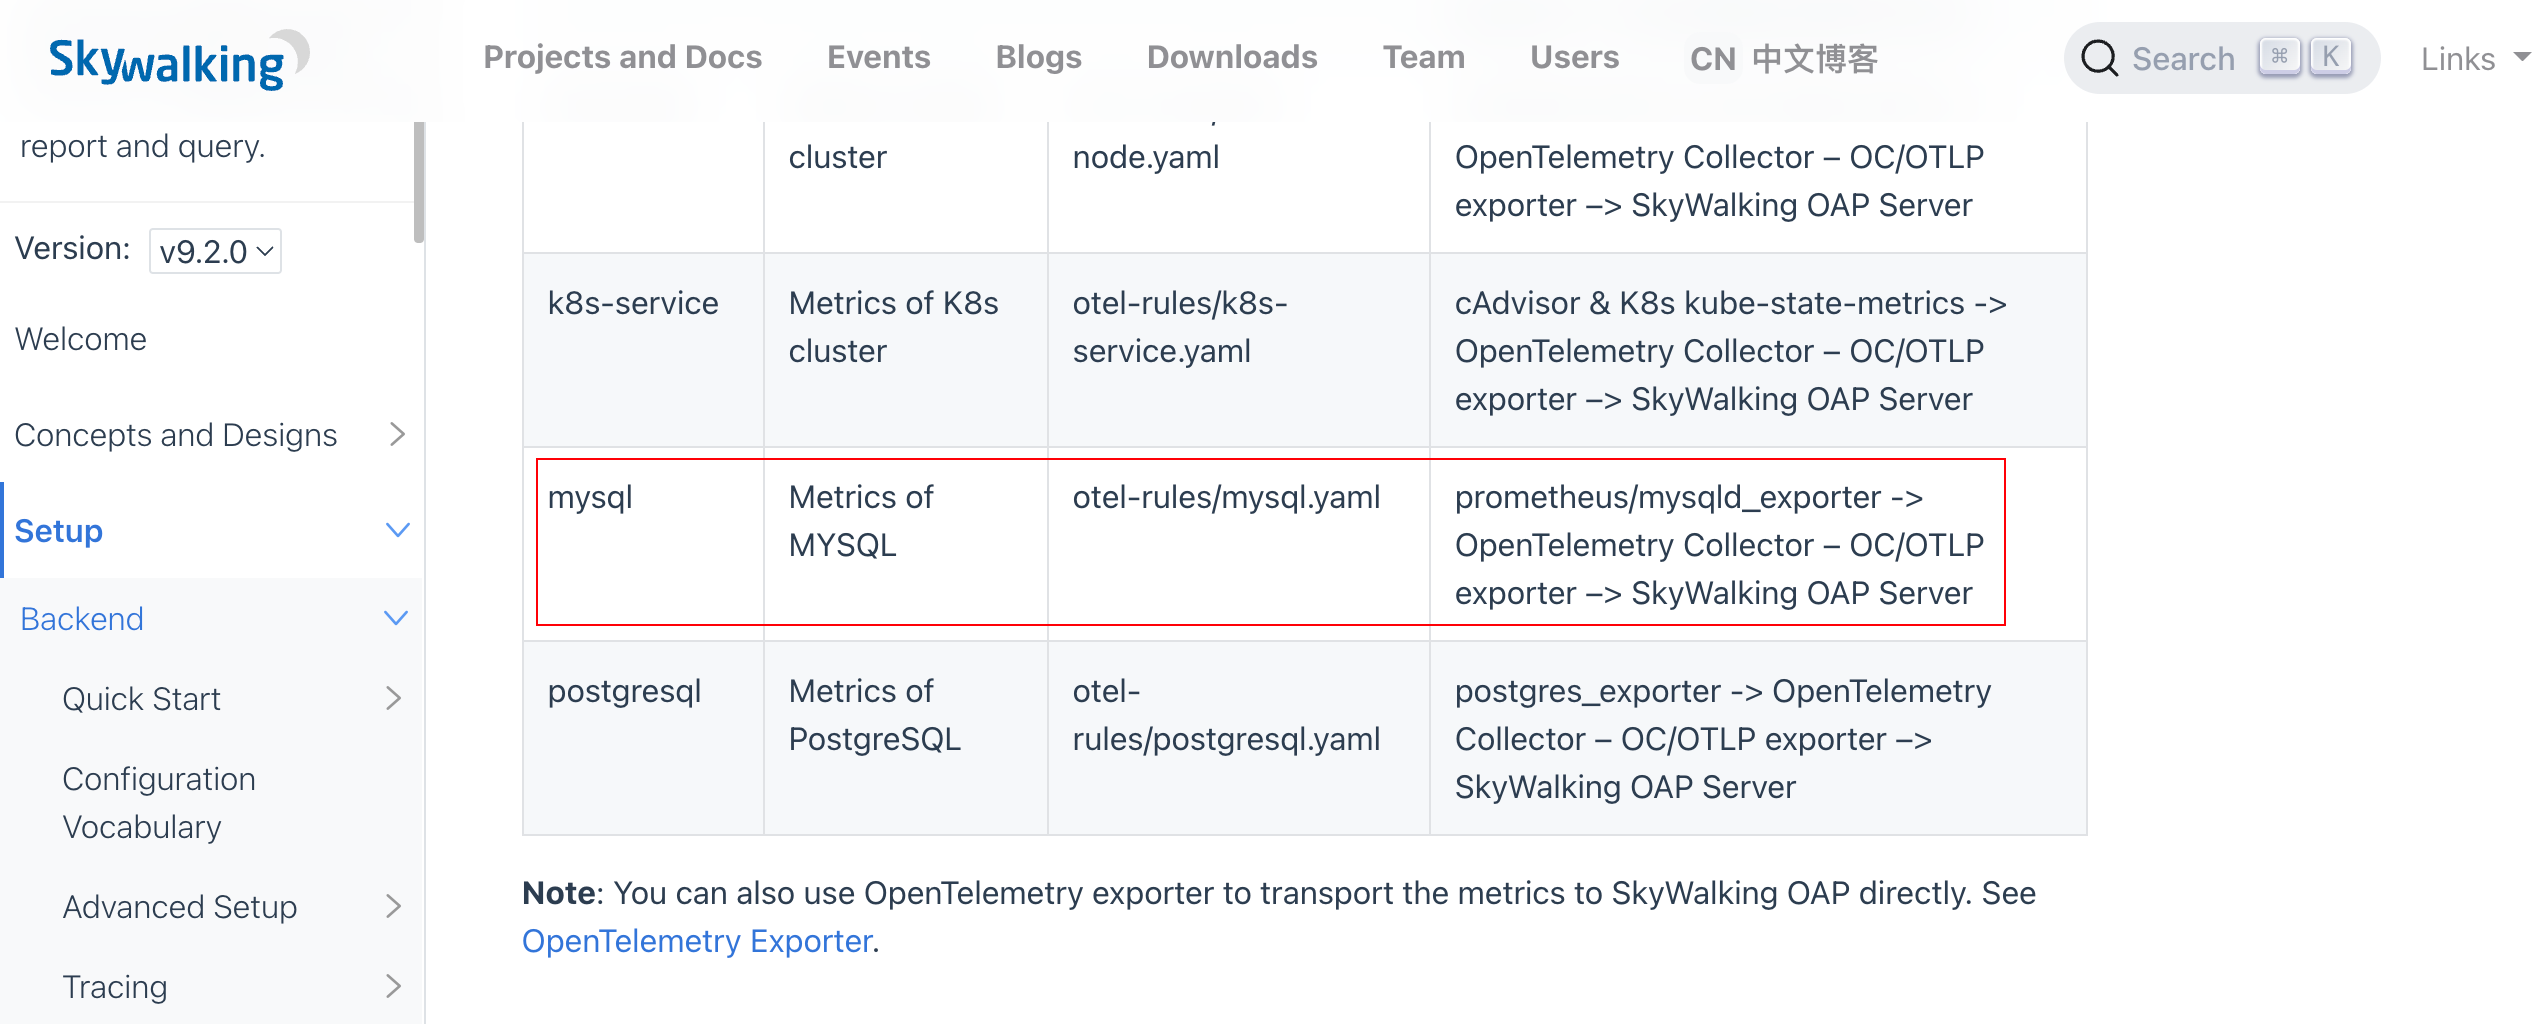
在otel-rules/mysql.yaml配之下指定了job_name的名称,于是更改后重启SkyWalking OAP就有数据了。